SklarPy (pronounced ‘Sky-Lar-Pee’ or ‘Sky-La-Pie’) is an open-source software for probability distribution fitting. It contains useful tools for fitting Copula, Multivariate and Univariate probability distributions. In addition to over 100 univariate distributions, we implement many multivariate normal mixture distributions and their copulas, including Gaussian, Student-T, Skewed-T and Generalized Hyperbolic distributions. Named after Sklar’s theorem and Abe Sklar, the American mathematician who proved that multivariate cumulative distribution functions can be expressed in terms of copulas and their marginals.
This library has many different possible use cases, ranging from machine learning to finance.
Contents
Why we are better
Unlike other Python implementations of copulas, we implement more than the Gaussian and Archimedean copulas. A full list of our implementated copula models can be found in the documentation, though it includes many normal mean-variance mixture models as well as Archimedean and non-parametric models.
We allow for easy parameter fitting of both the univariate marginals and the multivariate copula distribution.
We allow for easy plotting of all our distributions, allowing you to visualize your models.
We use scipy.stats as a backend for all our univariate models, meaning as scipy expands and improves their model selection, so will ours!
We provide multivariate and univariate distributions, in addition to our copula models, meaning SklarPy can act as a one-stop-shop for all probability distribution fitting. A full list of our implemented multivariate distributions can be found in the documentation.
We are continuing to expand our library, and are open to suggestions for new models to implement. If you have a model you would like to see implemented, please open an issue on our GitHub page.
Example
Here we show a quick example of working with SklarPy. For more information, see the specific documentaion.:
import numpy as np
import pandas as pd
import matplotlib.pyplot as plt
from sklarpy.copulas import gh_copula
# generating random data
n: int = 1000
obs: np.ndarray = np.full((n, 2), np.nan)
obs[:, 0] = np.random.normal(3,4, size=(n,))
obs[:, 1] = obs[:, 0] + 0.5 * np.random.normal(3, 5, size=(n,))
obvs_df: pd.DataFrame = pd.DataFrame(obs, columns=['Process A', 'Process B'])
# fitting our copula model
fitted_copula = gh_copula.fit(obvs_df)
# printing our fitted copula parameters
print(fitted_copula.copula_params.to_dict)
# printing our fitted marginal distributions
print(fitted_copula.mdists)
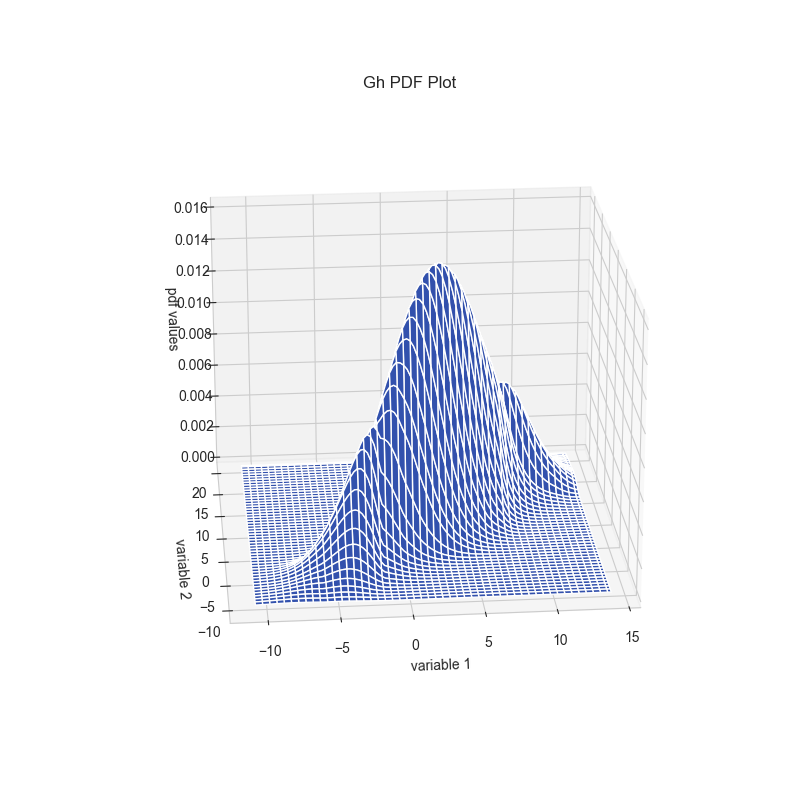
# plotting our fit
fitted_copula.pdf_plot(show=False)
fitted_copula.copula_pdf_plot(show=False)
plt.show()
This outputs:
{'lamb': -10.0, 'chi': 4.227038325195731, 'psi': 10.0,
    'loc': array([[0.], [0.]]),
    'shape': array([[1. , 0.84273015],
                    [0.84273015, 1.]]),
    'gamma': array([[0.99696041], [0.99913161]])}

{0: lognorm(0.02, -203.22, 206.18), 1: lognorm(0.04, -110.89, 115.4)}